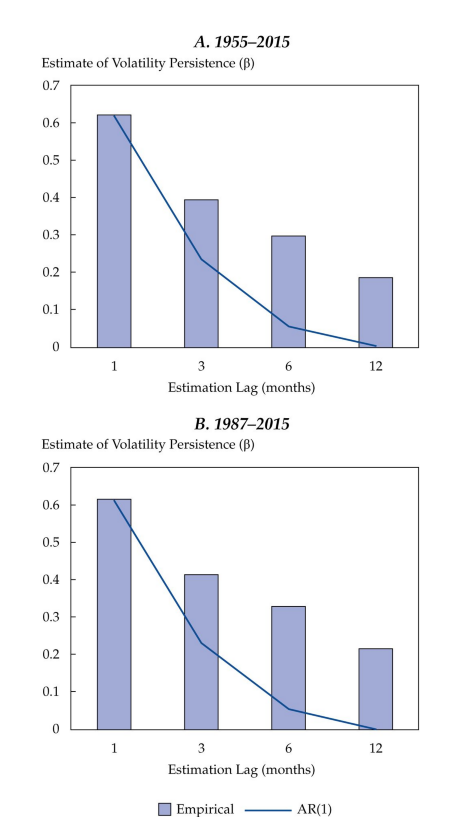
In Exhibit 3.8, the grey bars represent estimates of β for lags of 1, 3, 6, and 12 months, estimated using the volatility of S& P 500 returns over the past 60 years and in the post-Volcker period. We show that over the 1955– 2015 period, roughly 40% of the deviation of short-term (1-month horizon) volatility estimates from longer-term (5-year horizon) volatility reversed over a 1-month horizon— leaving 60% of the gap on average at the end of one month. Thus, a nontrivial proportion of deviations in volatility reverse over a short horizon. If the reversal of the deviation were to continue at the same pace, roughly 25% of it would remain at the end of 3 months, 6% at 6 months, and none at 12 months.
And about interes rates…
In Exhibit 3.9, we present estimates of β for lags of 1, 3, 5, and 12 months for the volatility of changes in 10-year US Treasury yields. In the sample since 1966, we find that roughly 40% of deviations reverse over a month, which is similar to the finding for equities (Exhibit 3.8). However, we find that roughly 40% of deviations remain even at the end of 12 months, which indicates a much greater degree of persistence in interest rate markets than in equity markets.
When we focus on the post-1987 period, we find that the speed of reversion of deviations in volatility (vs. long-term estimates) is a lot higher. Over a month, roughly 55% of the deviation reverses, and over 12 months, roughly 80% reverses— a result that is roughly in line with what we documented in the case of S& P 500 volatility.
Naik, Vasant ; Devarajan, Mukundan; Nowbilski, Andrew; Page, Sébastien ; Pedersen, Niels. Factor Investing and Asset Allocation: A Business Cycle Perspective (Locais do Kindle 1917-1919). CFA Institute Research Foundation. Edição do Kindle.
